
Summer Data Review: Using CViConnect Reports to Launch the School Year Strong
Introduction
Beginning the school year after a long break can feel overwhelming for learners with Cortical Visual Impairment (CVI). During summer, routines may slow down or shift. That means visual attention, stamina, and access strategies can change over time. If you used CViConnect PRO or Home over the summer, your data offers a clear starting point for this fall.
With activity session reports, you can review summer performance and create a plan that meets your student(s) where they are now.
 1. Open the Most Recent Session Reports
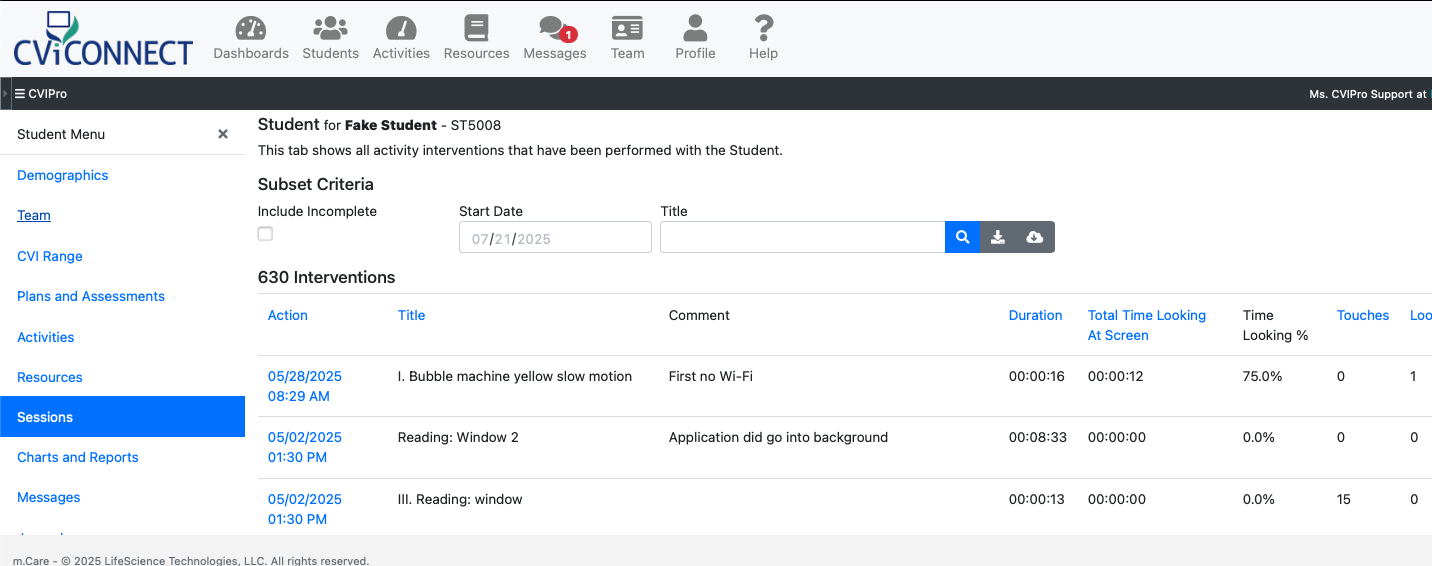
Start on your CViConnect PRO dashboard, within the Student’s Notebook,
select the sessions tab. Look for details like:
- How many sessions were completed
- How long those sessions lasted
- Which activities were used
- What percent of time is the child looking
These data points establish a real baseline for planning.
2. Review Eye Detection Data and Saliency Patterns
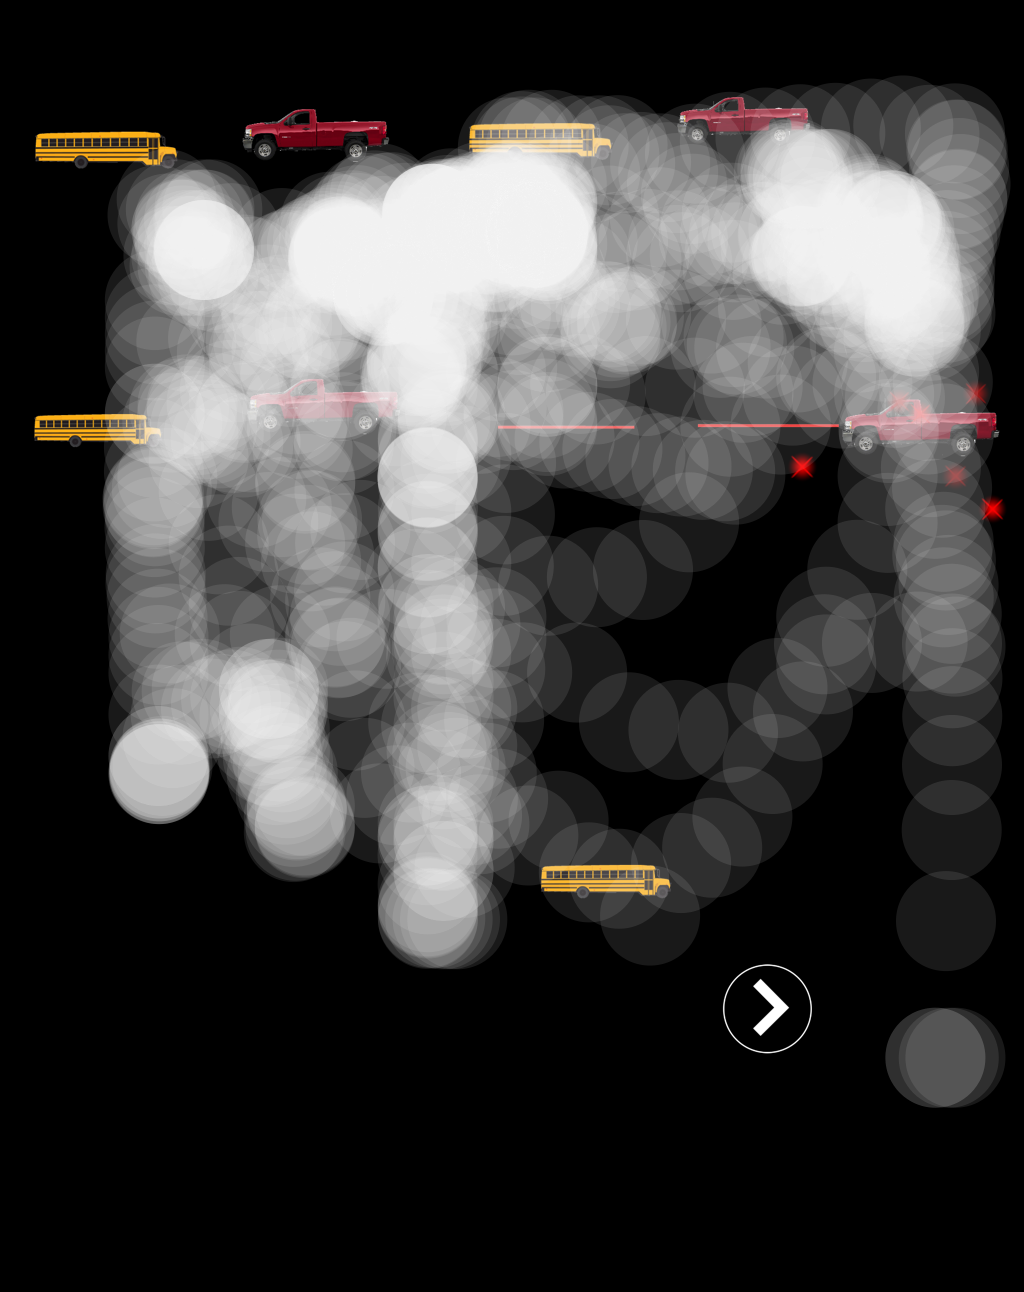
Start with activities your student consistently performs well with. Then, compare to activities they had a hard time with:
You might notice that any patterns, certain colors or movements now attract attention differently. These visual preferences help identify what materials to start with.
3. Track Visual Fatigue and Endurance
Compare session length and the number of breaks to spring data. Are session times shorter? Were more rest breaks needed? These pattern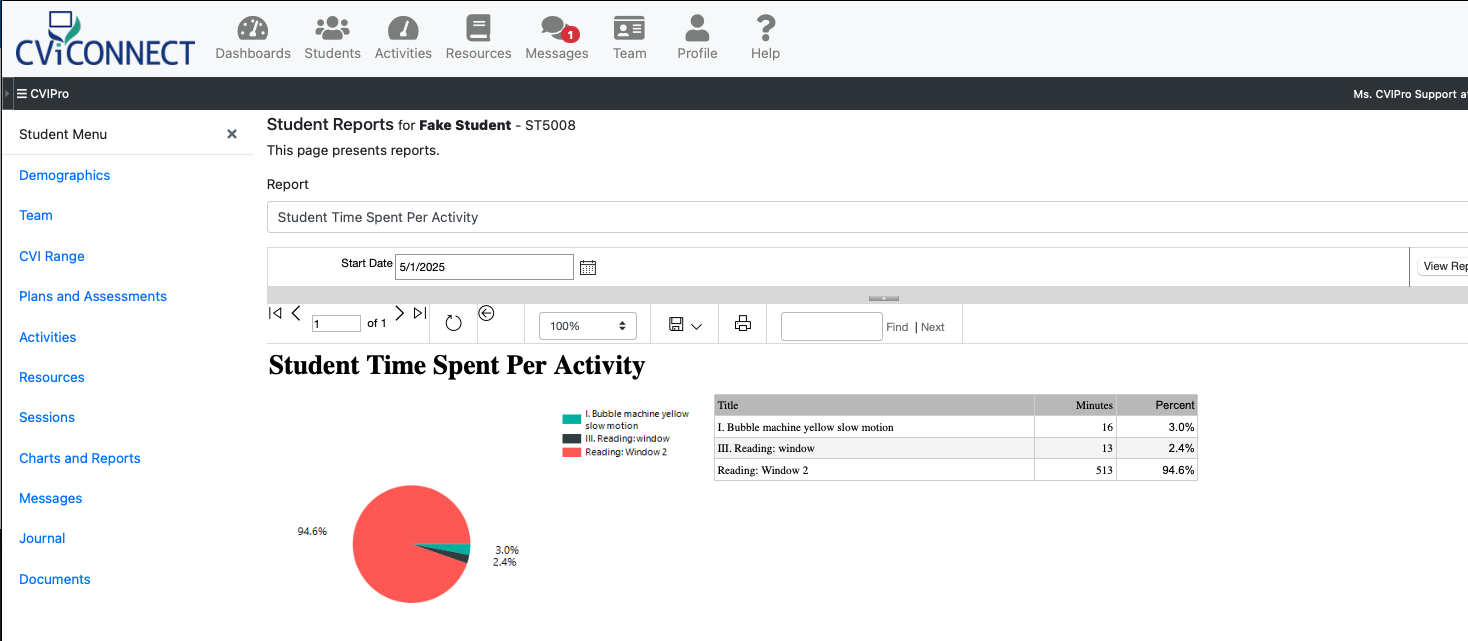 s are key to planning pacing and duration for fall sessions.
4. Draft or Update IEP Goals with Data
Use your observations to support or modify IEP objectives. For example:
- Adjust the complexity of visual targets
- Add or remove props that boost movement or audio cues
- Emphasize placement in the visual field if heatmap data shows missed engagement
Add these observations under Present Level of Performance and use them to inform measurable goals for the first quarter.
5. Plan First-Month Activities with Data in Mind
Use the Shared Library in CViConnect to select activities that match your observations. For instance:
- If you saw strong response to high contrast animation start with similar materials
- If engagement faded after a few minutes design shorter sessions that build stamina
Remember to always be thinking of how these activities will scaffold as your learner continues to use more visual function. The activities the team selects should align directly with what your student responded to over the summer and draw a clear line to where you expect them to progress.
Conclusion
Data from CViConnect can guide your fall planning with confidence. You no longer have to guess. Begin the school year with clear insight and targeted support based on your student’s actual summer performance.
Feel free to reach out if you would like help reviewing your data or selecting activities that connect with your goals for the first quarter.

Leave a Reply
Want to join the discussion?Feel free to contribute!